Automation Runtime Across Users
What this chart shows
- Displays the total automation runtime for each user, showing the top five users by total execution time.
Why it matters
- Helps you identify who is running the most automation and where most resources are being used.
How to view it
- On the homepage, go to the Automation Runtime Across Users widget.
- The chart automatically displays the top five users for the selected project and period.
- Hover over each bar to see the runtime values per user.
Example view:
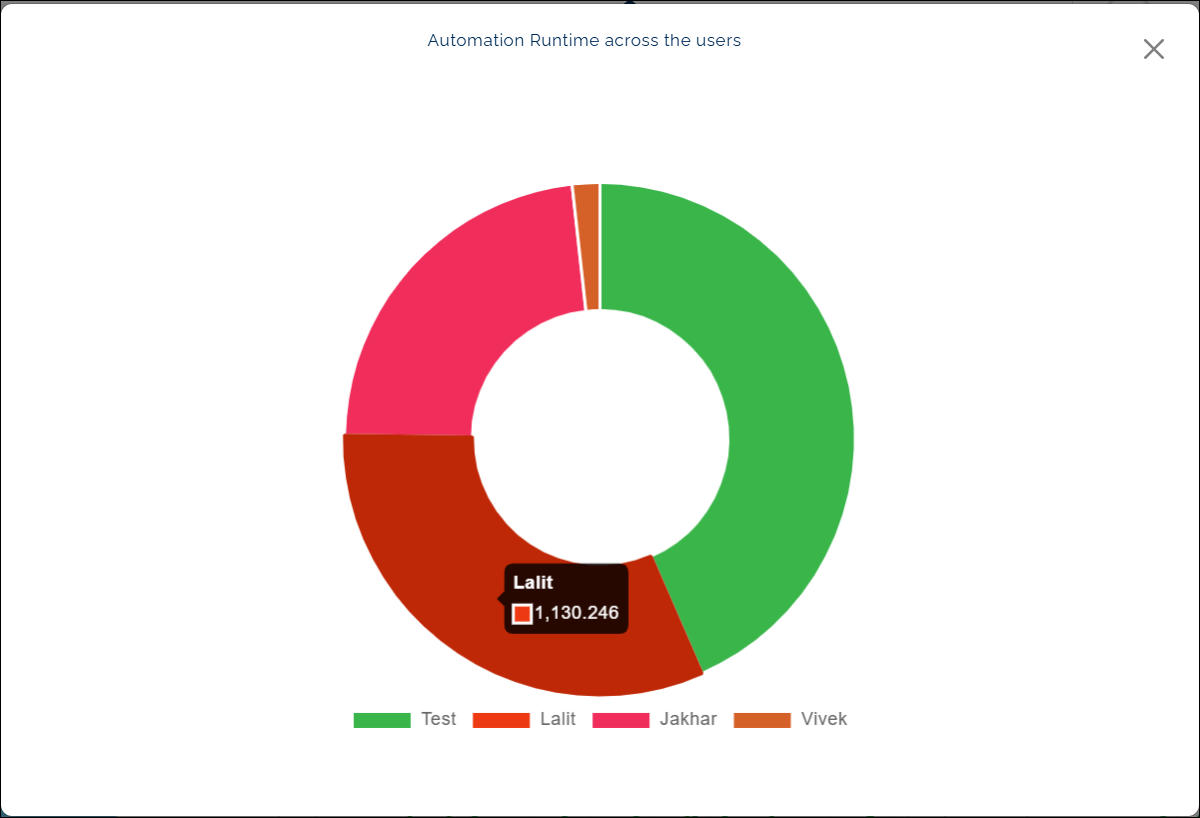
Click a user label to temporarily hide that result type from the chart. The label appears struck through, and the chart updates instantly.
Last updated: Oct 14, 2025