Runtime for Suites
What this chart shows
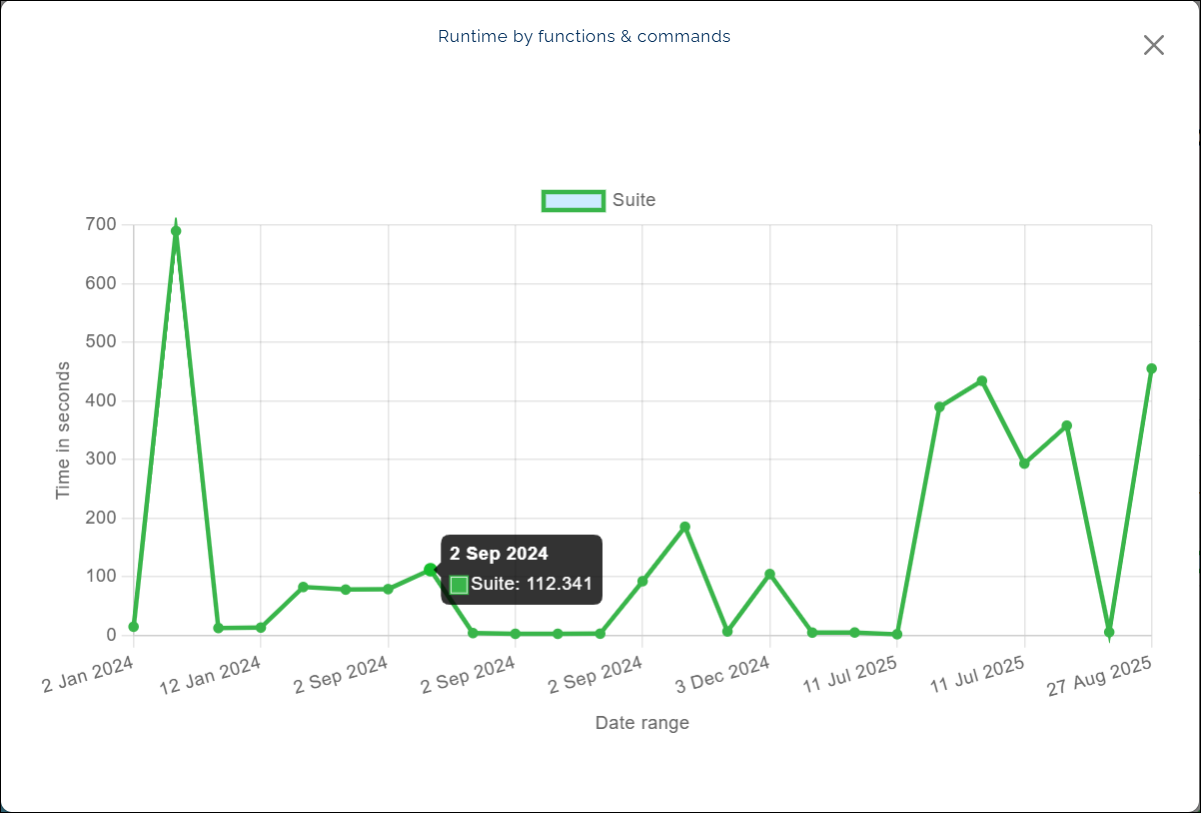
The Runtime for Suites chart displays the total time taken by different suites to run within a selected project and date range.
It appears as a single line chart, with points plotted to represent runtime for specific dates.
- The bottom of the chart shows the dates for the selected period.
- The side of the chart shows runtime in seconds.
When you hover over a point on the line, a pop-up appears showing the date and runtime for that automation suite.
Why it matters
This chart helps teams understand how suite runtimes change over time.
It allows you to:
- Identify dates with higher runtime.
- Track performance trends of your suites.
- Make informed decisions for optimizing automation workflows.
How to use it
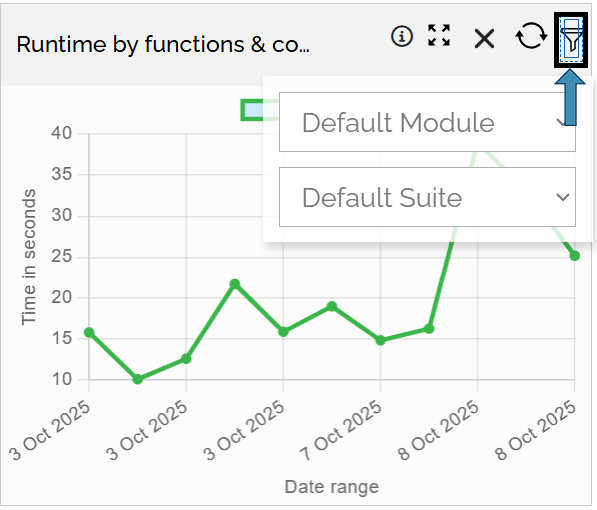
- Select a Module and Suite name using the Filter icon.
- Hover over any point on the line to view the date and runtime.
- Compare points along the line to spot increases or decreases in runtime.
- Change the date range or project filter to focus on specific timeframes.
Example view