Manage Widgets
You can customize the HuLoop dashboard by adding, removing, or rearranging widgets. Each widget displays a specific chart or statistic about your automation activity.
Add a Widget
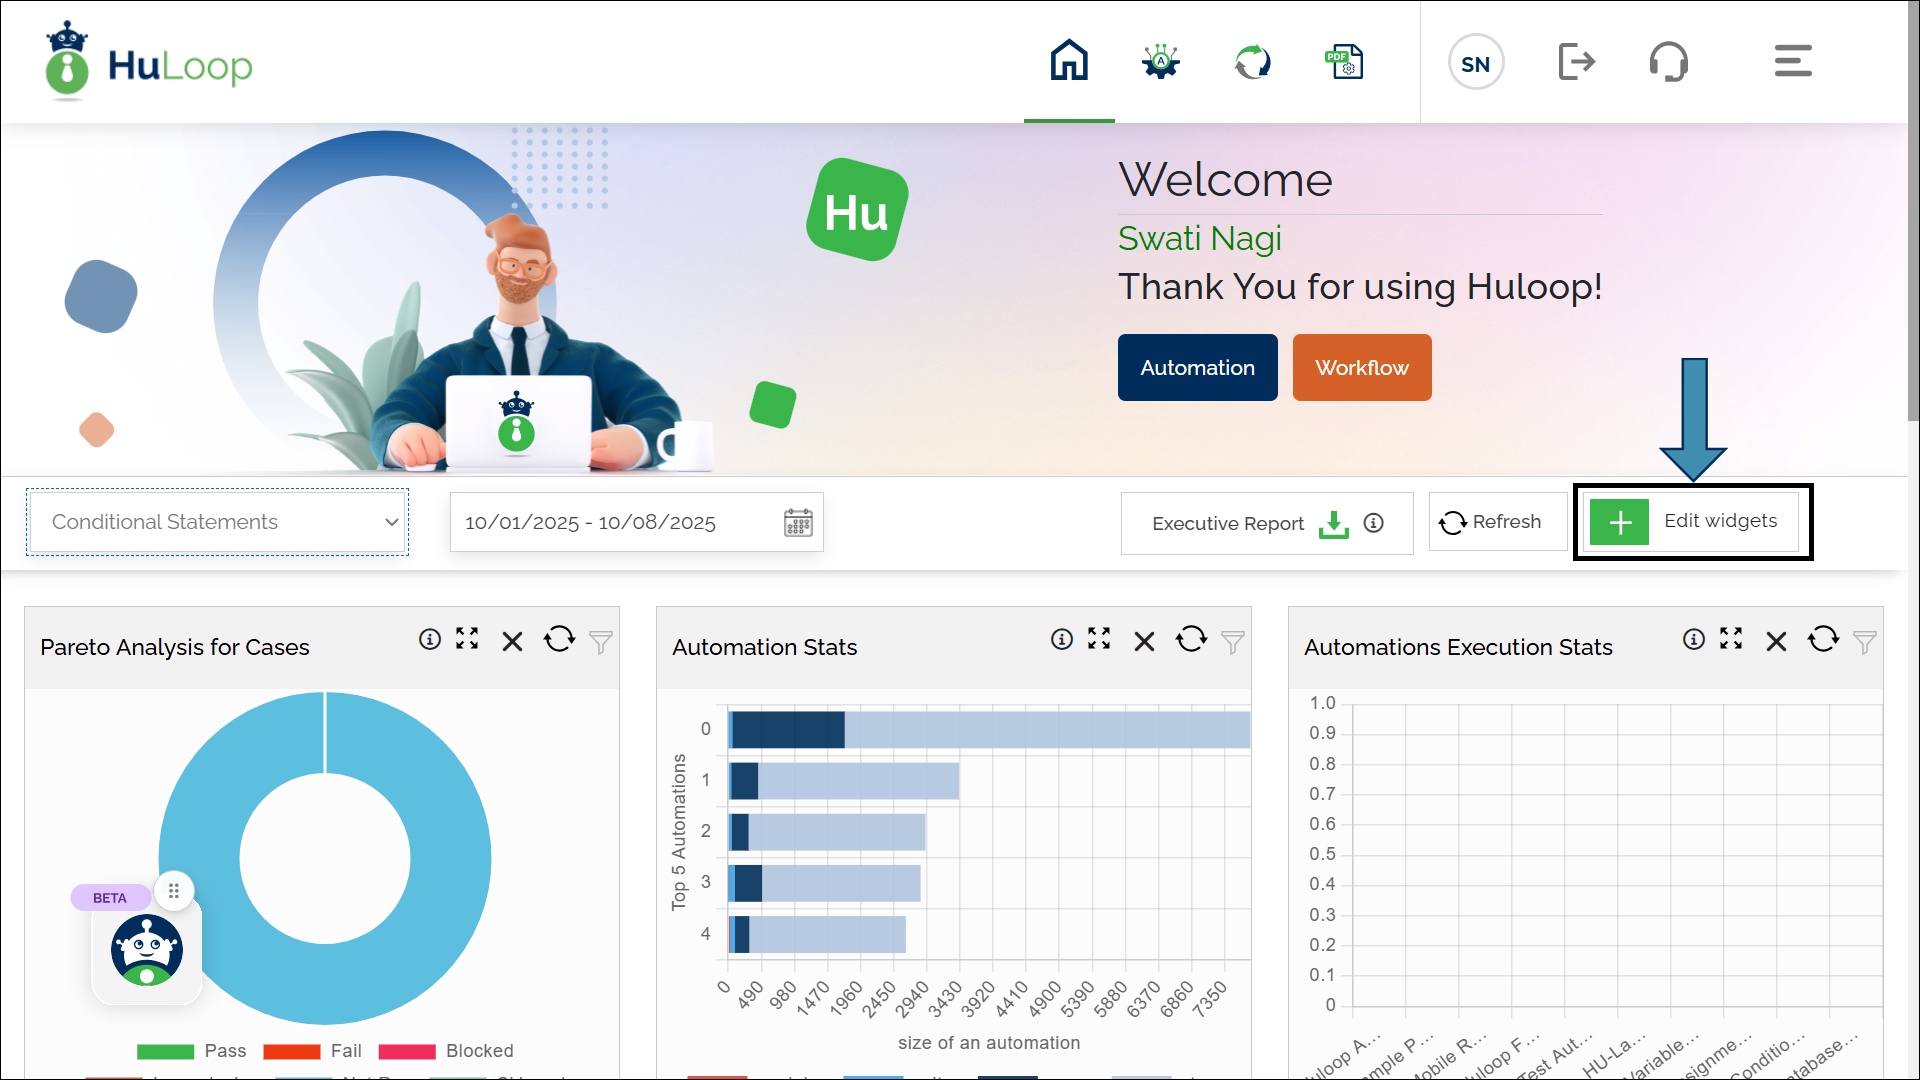
- On the HuLoop homepage, open the Edit Widgets drop-down.
- Type the keyword or full name of the chart you want to add.
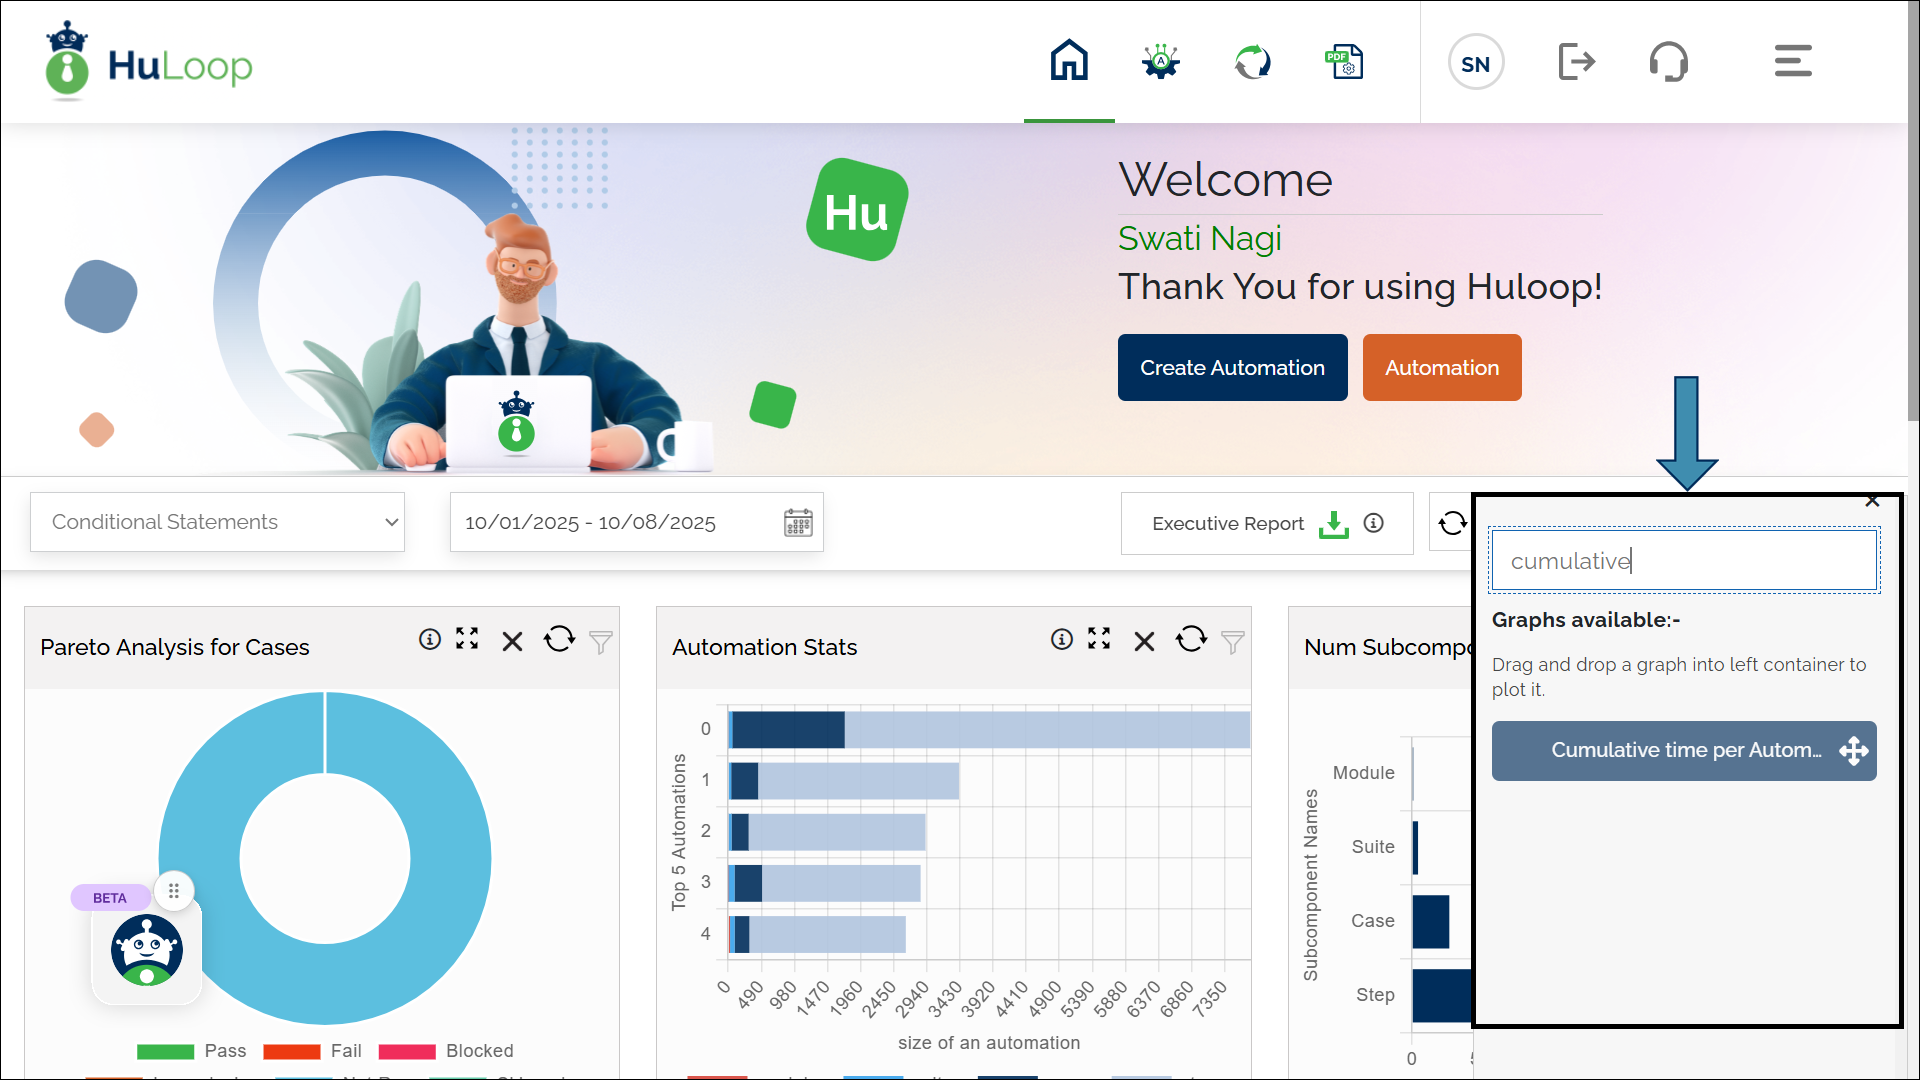
- From the list that appears, drag the desired widget to the left container and drop it there.
- The widget is added to your dashboard. You can change its position anytime by dragging and dropping it to a new location.
Widget Icons
Each chart on the dashboard includes a set of icons that help you manage it:
| Icons | Purpose |
|---|---|
| Information
| Hover to view a short description of what the chart shows. |
| Expand
| Click to view a larger version of the chart. |
| Remove
| Click to remove the chart from your dashboard. |
| Refresh
| Click to reload the chart with the most recent data. |
| Filter
| Available on selected charts. Click to apply filters such as project, user, etc. |