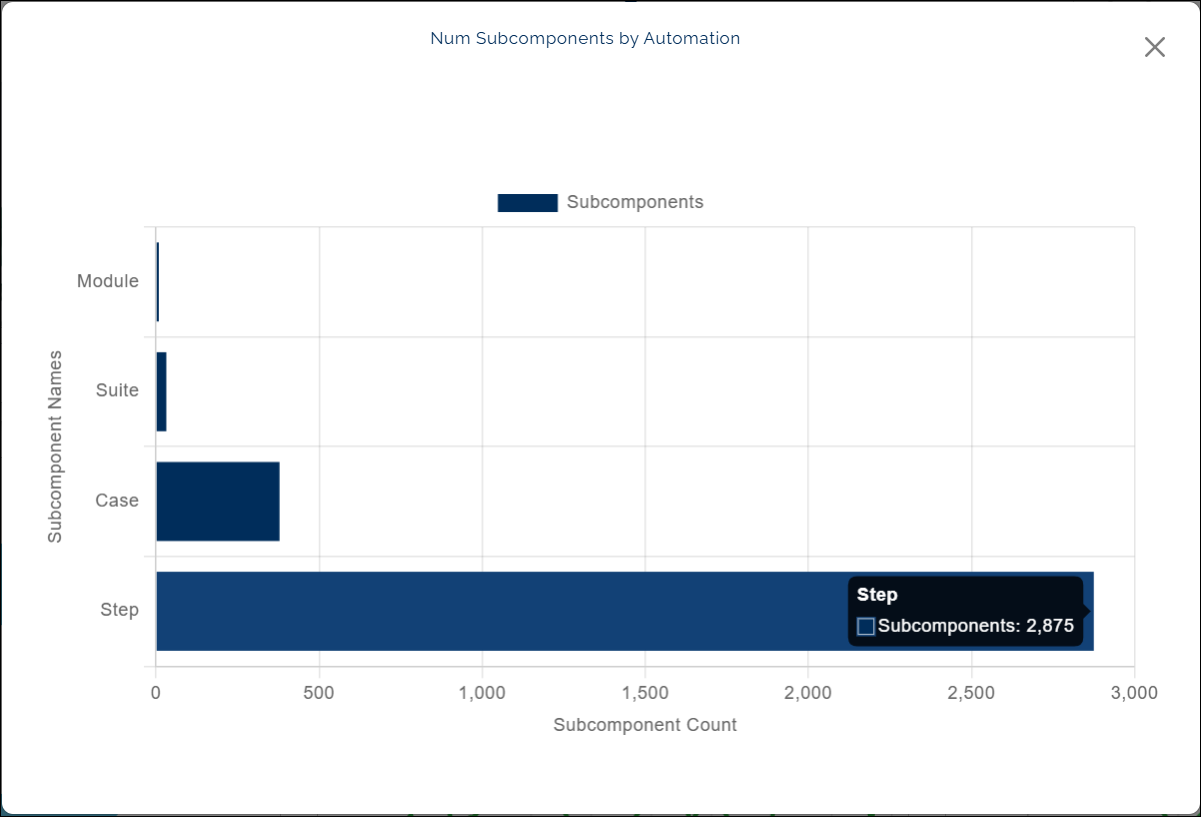
Num Subcomponents by Automation
What this chart shows
- The Num Subcomponents by Automation chart shows how many subcomponents exist within your automations.
- It displays a horizontal bar for each subcomponent type: Module, Suite, Case, and Step.
- The length of each bar shows the total number of items in that category.
- When you hover over a bar, a small pop-up appears showing the exact count for that subcomponent.
Why it matters
- This chart helps you understand the structure of your automation work.
- It shows how your automations are built and whether certain subcomponents are used more often than others.
- You can use this information to plan development or balance automation coverage.
How to use it
- Hover over any bar to view the total number of items in that subcomponent.
- Compare the bar lengths to see which subcomponents have the highest or lowest counts.

