ROI-Total Savings
What this chart shows
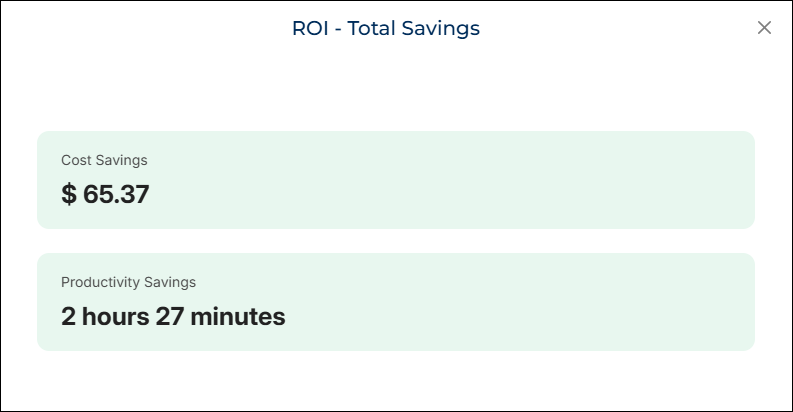
The ROI-Total Savings widget shows the overall value delivered by your selected automation during the chosen date range.
It displays two key metrics:
- Cost Savings – the financial value saved, shown in dollars
- Productivity Savings – the total number of hours saved
Why it matters
This widget gives you a clear snapshot of the total benefit gained from your automation.
It helps you understand:
- How much manual effort the automation eliminated
- The financial impact of using automation instead of manual work
- The overall value delivered during a specific period
You can use this view for decision-making, reporting, and tracking the performance of individual automations.
How to use it
- Select your Date Range from the filters.
- Choose your Automation.
- The widget displays:
- Cost Savings in dollars
- Productivity Savings in hours