Runtime by Automation
What this chart shows
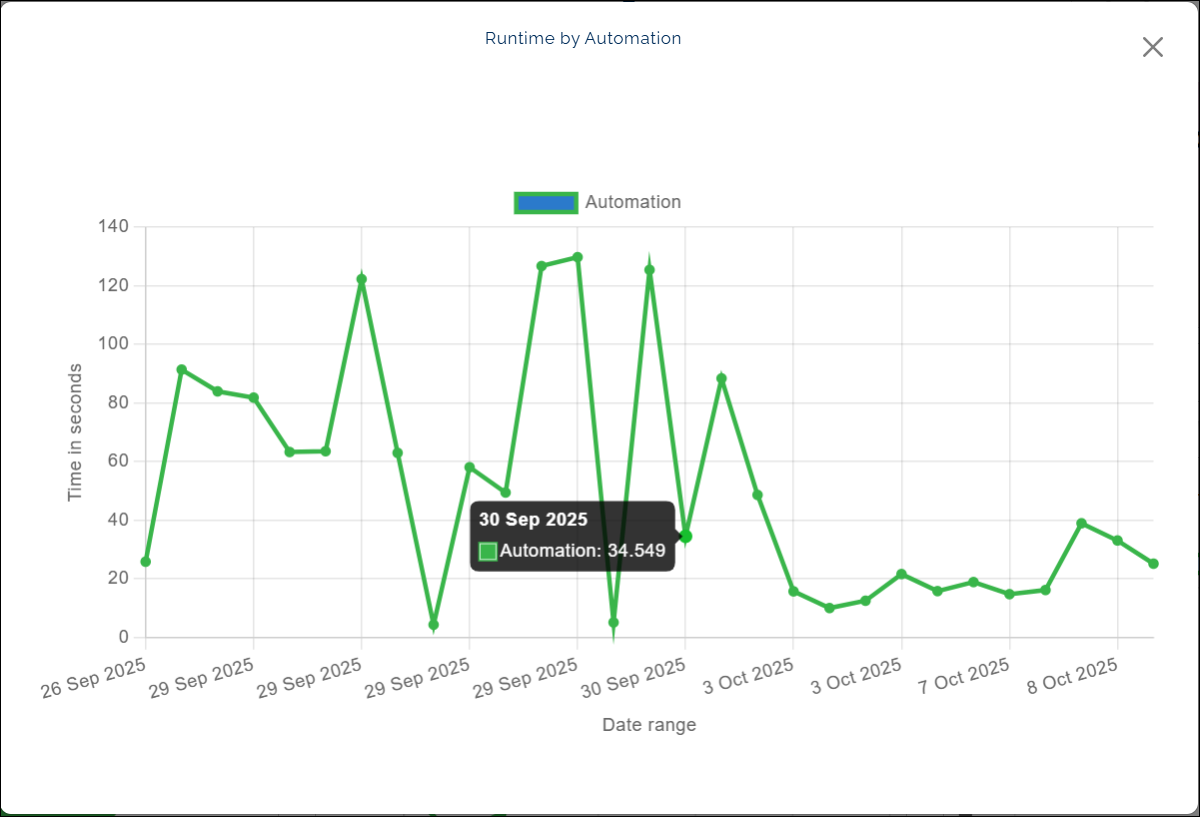
- The Runtime by Automation chart shows how long the selected automation takes to run over a chosen period.
- It appears as a line with several points, each point marking the runtime recorded on a specific date.
- When you hover over a point, a small pop-up appears showing the date and the time taken in seconds.
Why it matters
- This chart helps you track how the runtime of a particular automation changes over time.
- You can use it to identify performance trends, such as runs that are taking longer or completing faster.
How to use it
- Hover over any point to view the date and runtime in seconds.
- Follow the line to see how the runtime changes across different dates.
Example view: