Runtime by Operating System
What this chart shows
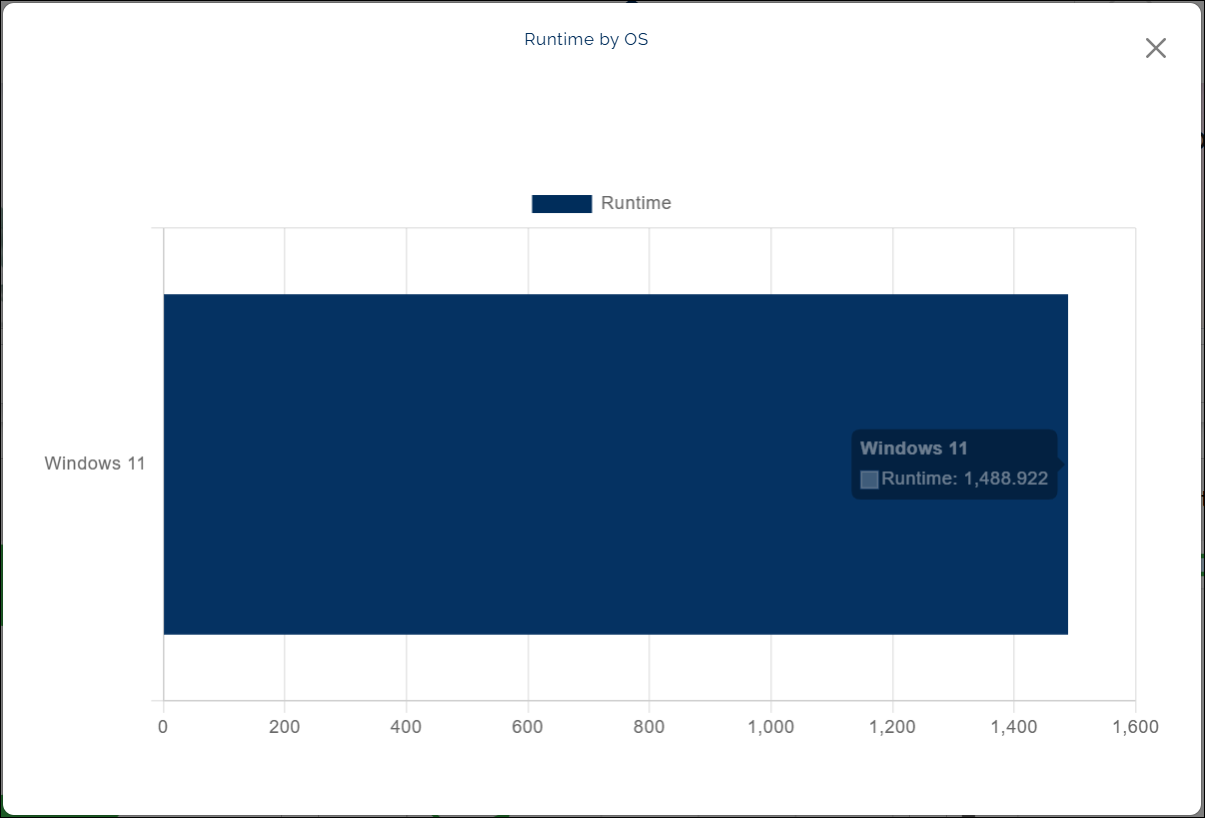
- The Runtime by Operating System chart shows the total time automations take to run on each operating system, such as Windows, Linux, and macOS.
- It appears as a series of bars or blocks, each one representing a specific operating system.
- When you hover over a bar, a small pop-up appears showing the operating system name and the total runtime in seconds.
Why it matters
- This chart helps you understand where your automations are spending the most runtime.
- It can show whether certain operating systems take longer to complete runs, which may help identify environment-specific performance differences.
How to use it
- Hover over any bar or block to see the operating system name and runtime.
- Compare the bar heights to understand which systems have longer or shorter runtimes.
Example view: