

Automation Debugger Inspection Tool
Debug Mode of the Automation Debugger Inspection Tool enables users to execute automations with enhanced visibility and control, and to inspect the state of a running automation. Key capabilities include:
- Breakpoint Management – Set breakpoints at specific steps to pause execution on demand.
- State Inspection – Examine variable values and runtime state at any breakpoint to diagnose issues.
- Live Logging Stream – Track execution progress with live logs that indicate which step the automation is currently executing.
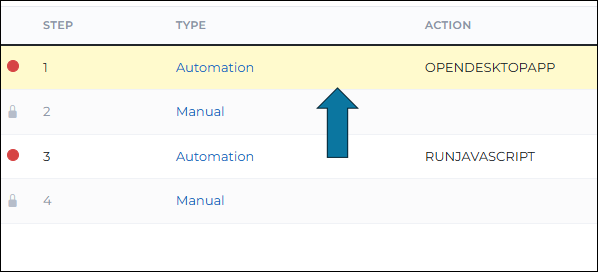
- Current Step Indicator – As steps in the automation are completed, they will be highlighted in yellow.
- Execution Summary – A progress bar that allows users to visually glance at the overall progression of the automation during the exaction time, with breakpoints indicators and color states.
- Watches – A custom tracking tool that evaluates specific variables or expressions in real time as your program runs.
This allows users to step through automation workflows incrementally, inspect intermediate values, and identify bottlenecks or errors without running the entire process end-to-end.
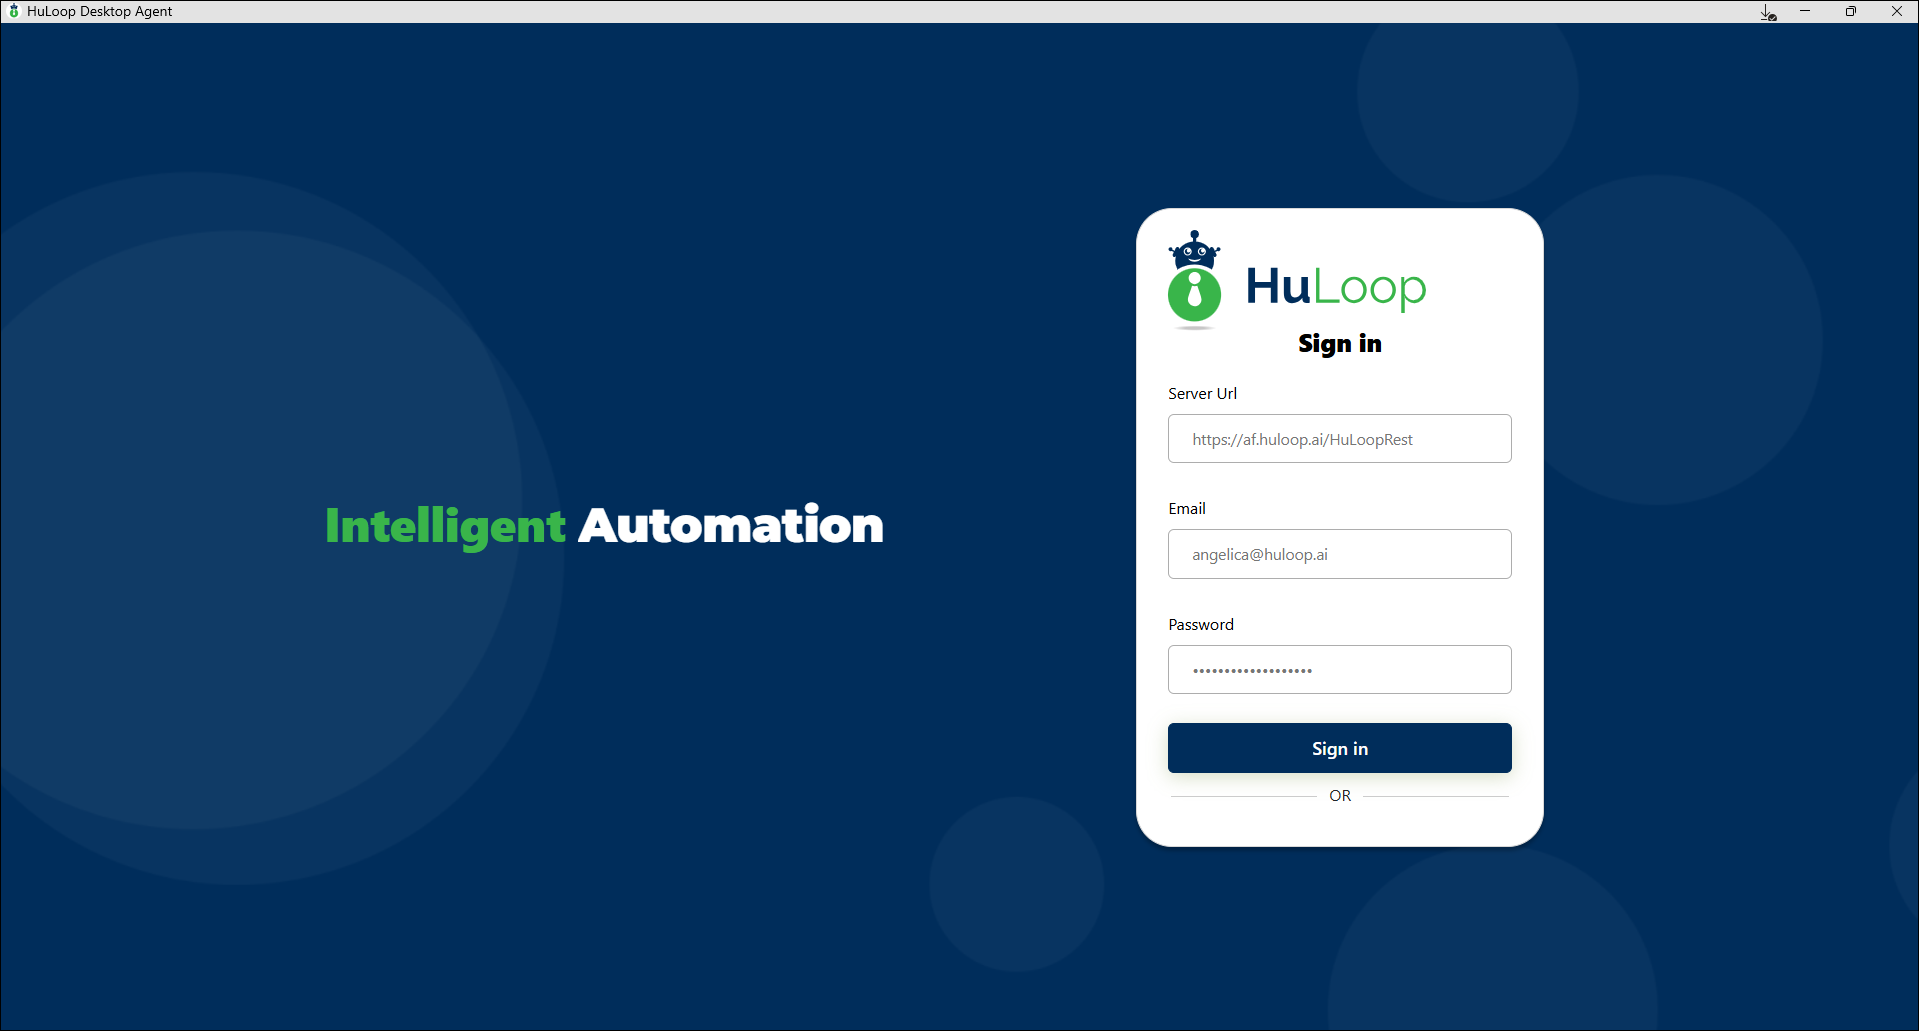
Step 1.
Open the HuLoop Desktop Agent with your credentials.
Step 2.
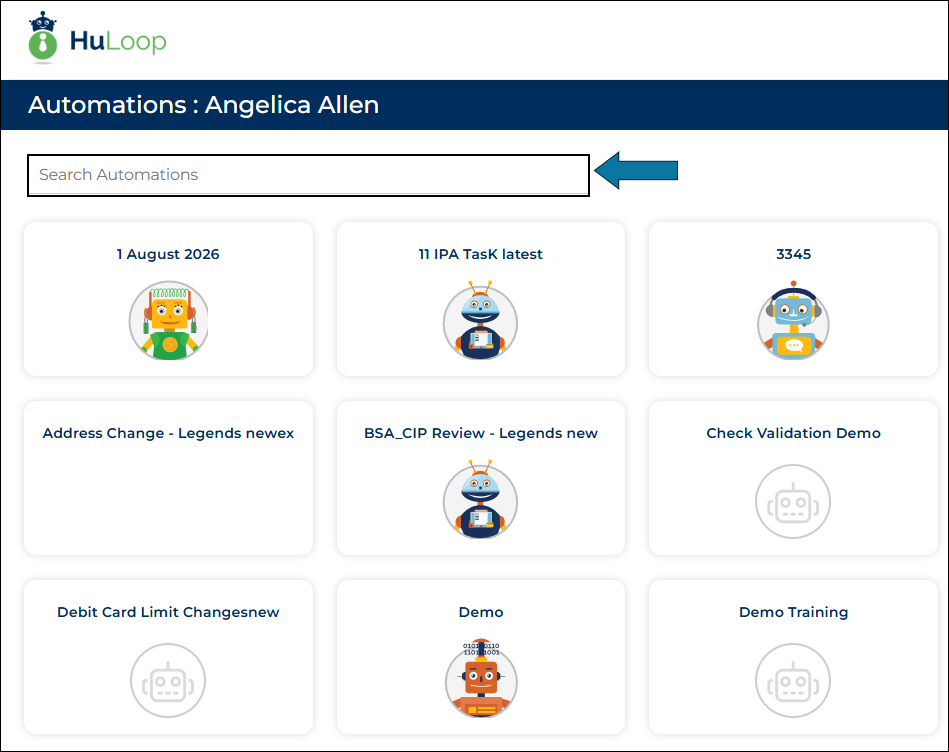
Select the Automation you want to run Debug Mode on.
You can search for the Automation you want to find it faster.
Step 3.
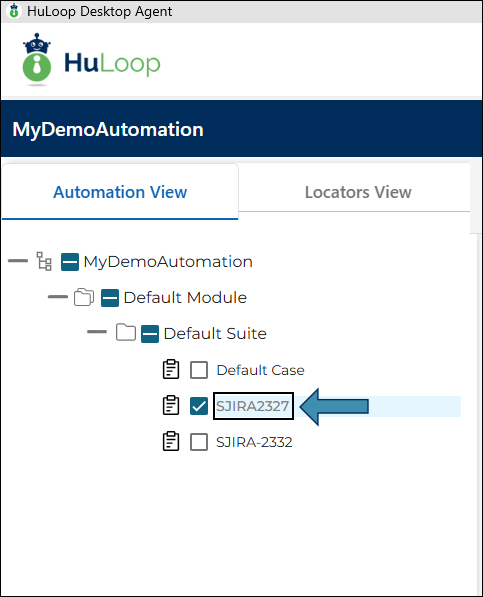
After selecting your Automation, click the part of the Automation Tree you want to run Debug Mode on.
Step 4.
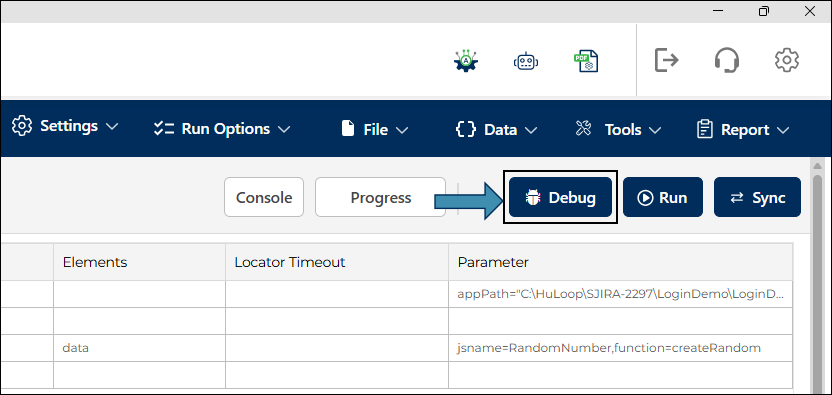
Click Debug.
Step 5.
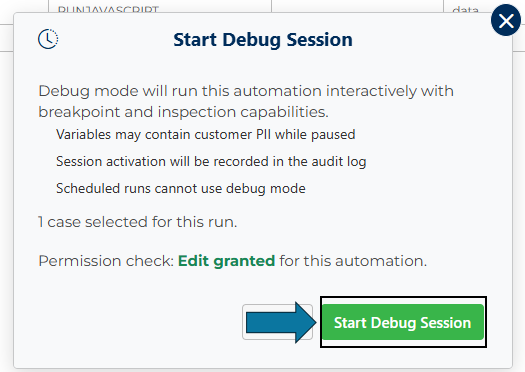
Click Start Debug Session.
Step 6.
Select the steps you want to Debug. A red dot will appear when selected.
 symbol next to them.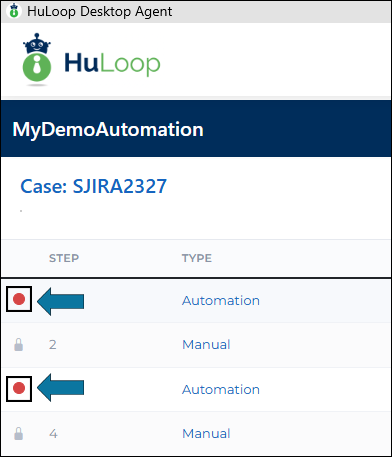
Step 7.
Press Play.

“Debug Ready” will appear when you can Press  to Start Debugging
or Press  to Exit.
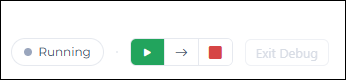
After pressing , “Running” will appear, and you can Press  to Skip Steps
or Press  to Stop Debugging.
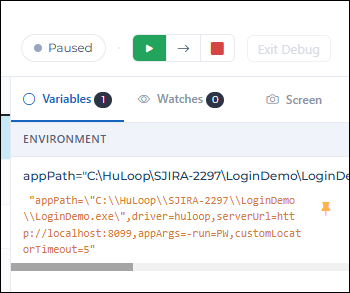
“Paused” will appear when you have debugged your most current step. You can see the Variables under the Environment section.
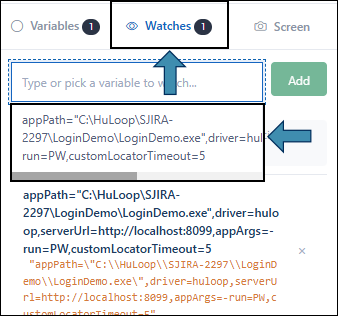
Select Watches to type in or pick a Variable you want to watch.
*Screen feature pending*
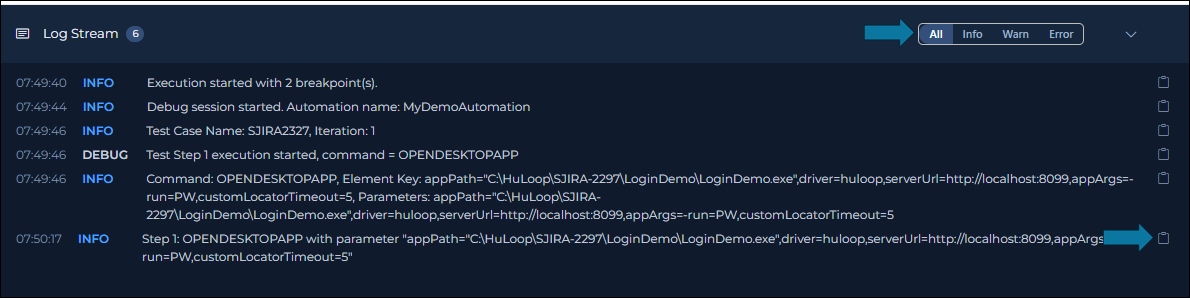
There is also the Log Stream where you can filter different you can select “Error” to only view the errors in the Log Stream.
- All: Everything will be shown
- Info: Only Info Level logs will be shown
- Warn: Only Warnings will be shown
- Error: Only Errors will be shown
Press  on the Log Stream to copy the text to paste it in another area.
Step 8.
Press to Continue.
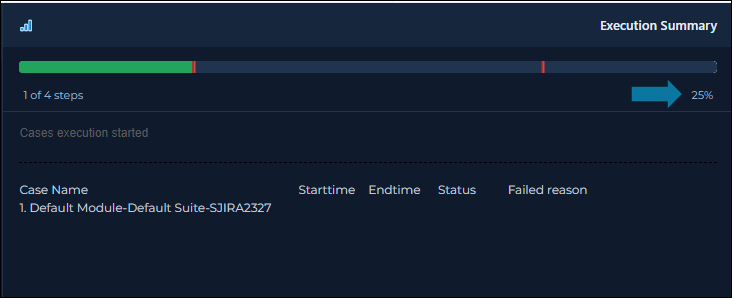
At the bottom of the screen, you will also see the Execution Summary. This shows the Progress Bar that displays how far along the debugging process is out of 100%.
Step 9.
 will appear when your Debugging process is complete and you can Press to exit.
Last updated: Sept 9, 2026
